WG3: Visualizing Spatio-temporal Patterns of Animal Movement
Working group leader: Hans van Gasteren
WG3 will use data produced by the weather radar network to quantify spatio-temporal patterns of aerial animal movements at different scales in space and time.
The following activities will be the focus of WG3:
- Evaluation of infrastructure for efficient storage and retrieval of biological information extracted from weather radars in close cooperation with OPERA.
- Fostering collaboration between computational scientists and biologists to design infrastructure for efficient visualization of biological information extracted from weather radars and the most relevant environmental factors.
- Mapping animal movement at large scales (across multiple radars).
- Evaluation of statistical modelling approaches to quantify the influence of atmospheric dynamics on animal movement (local to continental).
- Investigating the degree of spatio-temporal correlation between radar sites for different movement patterns and taxa and the causal factors underlying the large-scale patterns.

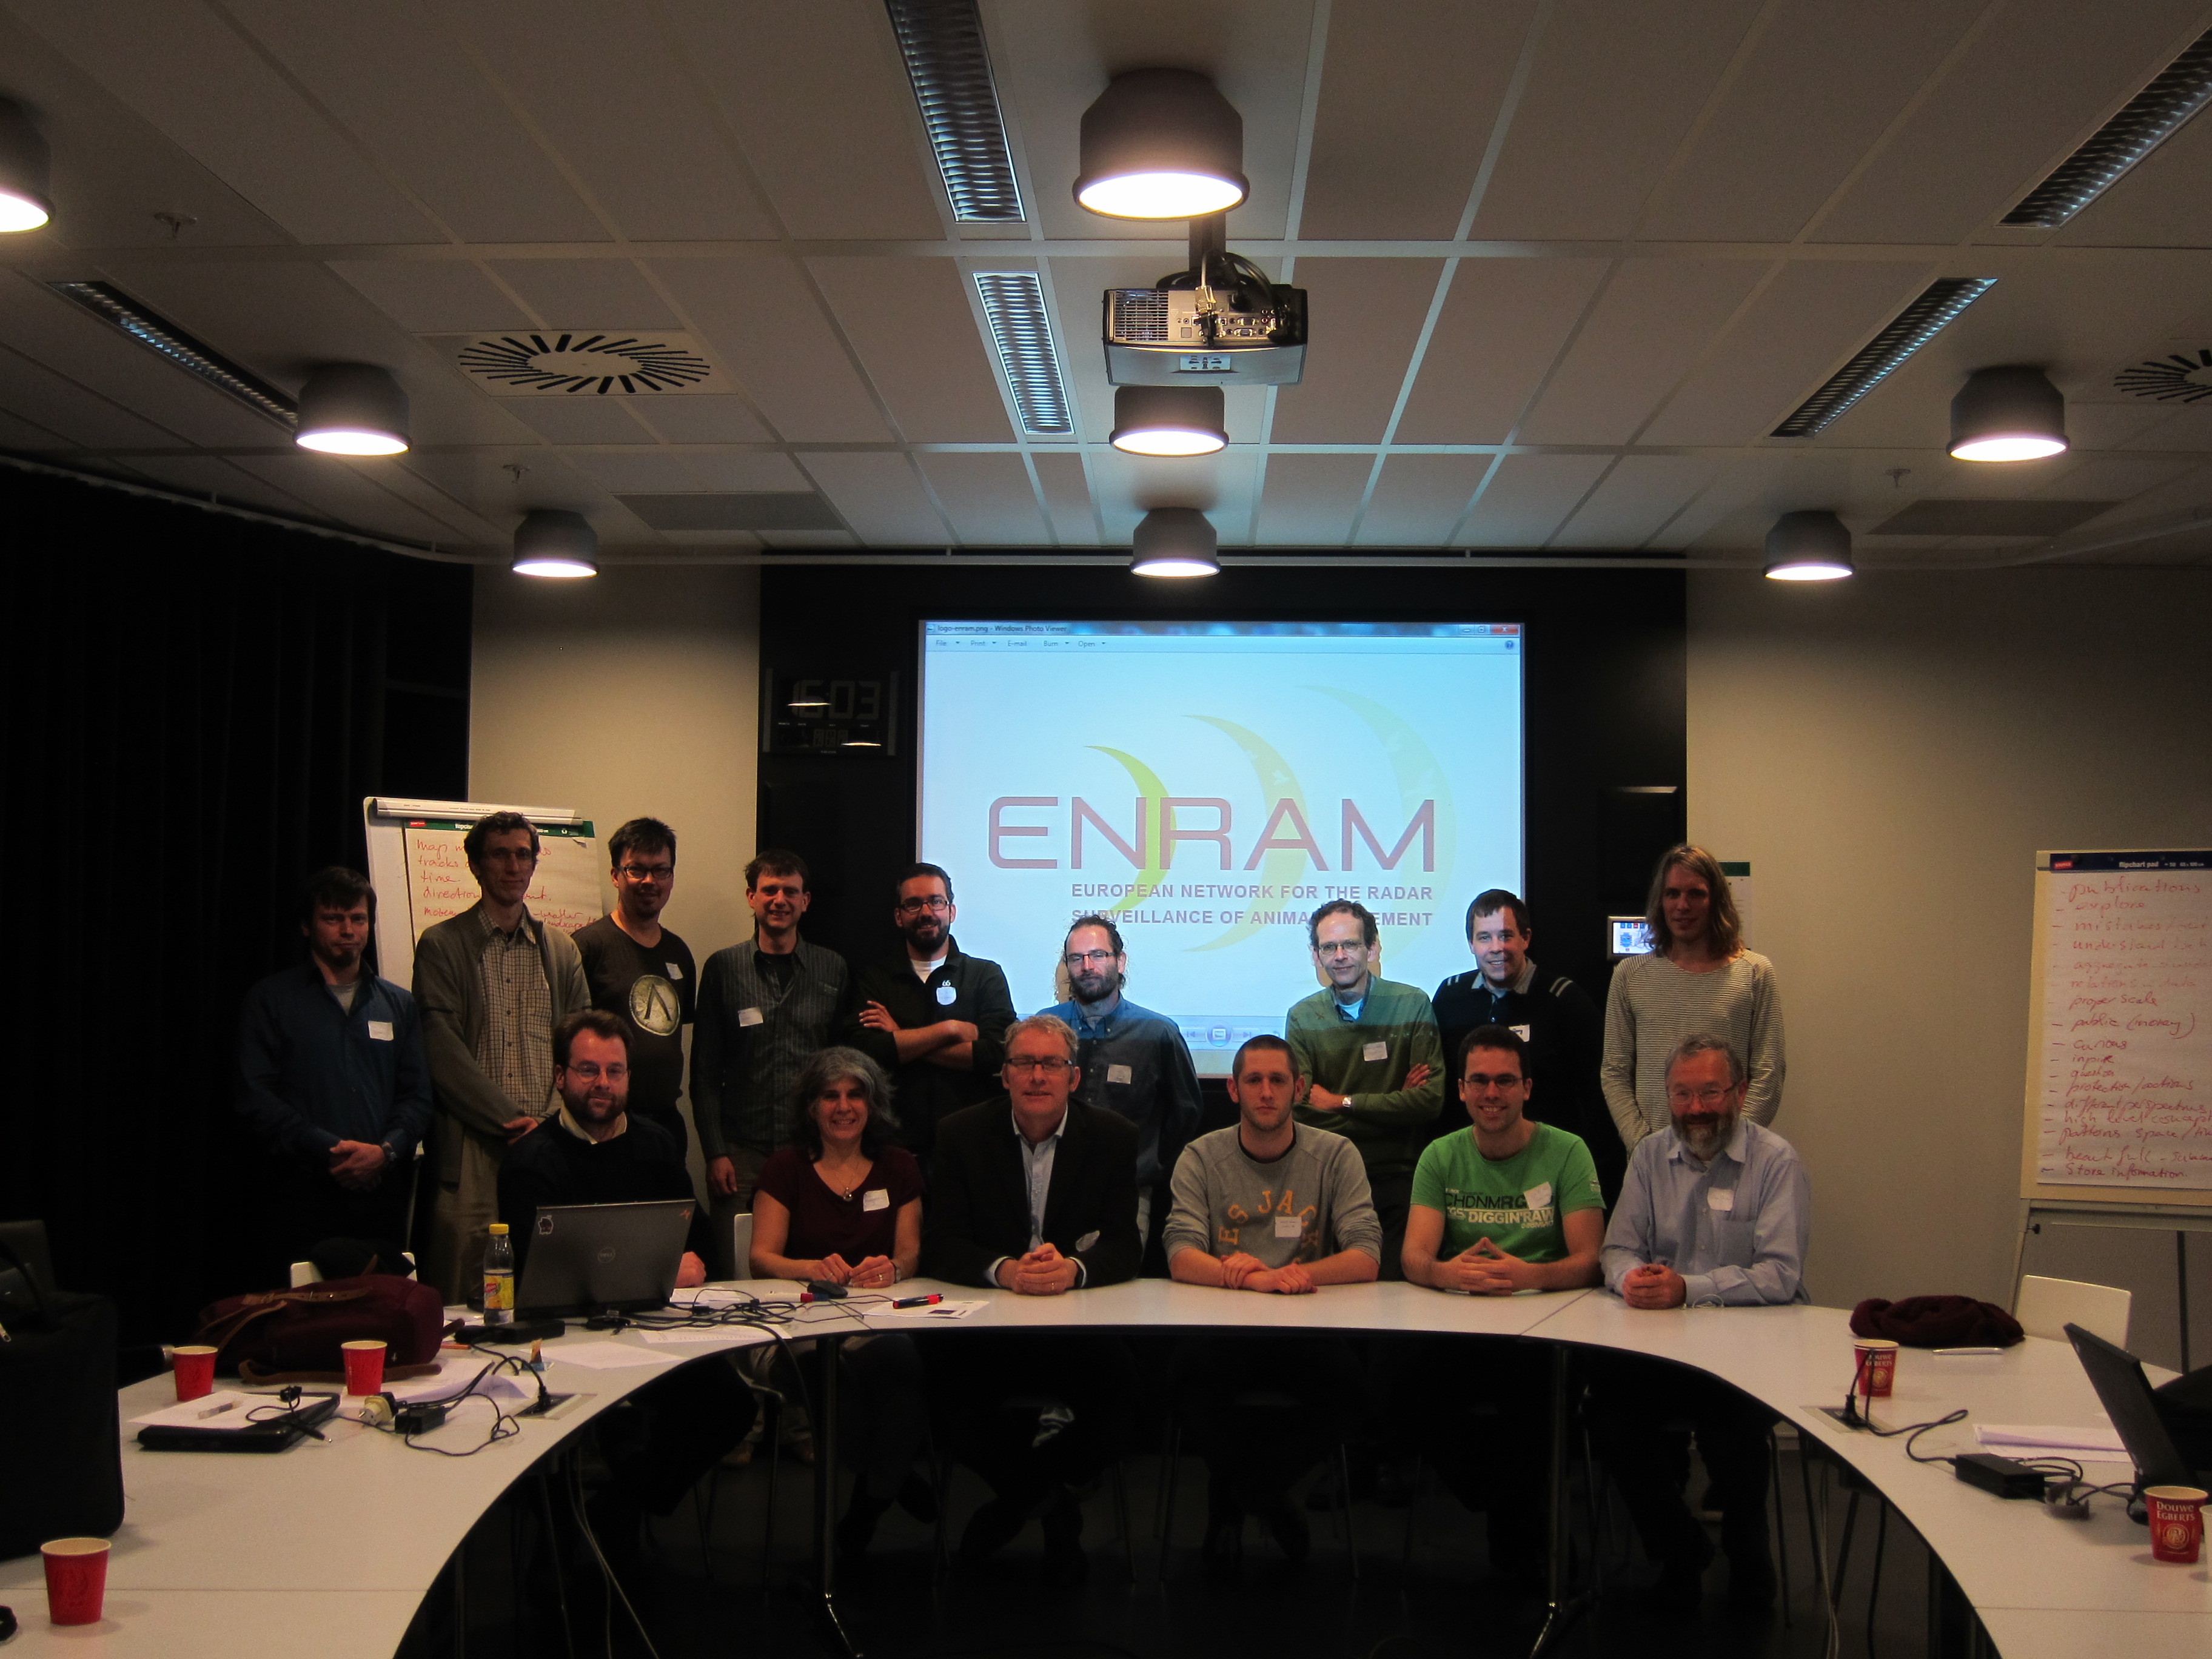
Workshop visualization
Amsterdam, 07.02.2014
Working groups
Meetings
Visualizations: from show cases to production
Amsterdam, 25 – 27 March, 2015
Bird migration visualization and challenge hackathon
Amsterdam, February 7th, 2014
Visualization Workshop

